
This article describes a technique for debugging microcontroller firmware when a full-featured debugger or equivalent functionality is not available, and when print-statement debugging (also known as printf() debugging) is cumbersome due to the high rate at which debugging data is generated. The capture log technique involves storing the debugging data in memory buffers during normal execution, and later extracting and examining the data. Several methods are available to conditionally store only the debugging data that is needed to isolate a firmware problem.
This debugging technique is primarily aimed at C and C++ firmware developed for the Arduino or Teensy microcontroller platforms using either the Arduino or PlatformIO integrated development environments (IDE). However, it is equally applicable to other limited-resource platforms that do not have access to a high-speed file system for data logging.
The capture log technique is useful for my own applications, which generate animations for addressable LED strips at a 100 Hz frame rate. Printing even a single variable at this rate quickly fills the screen, and data can be lost due to the limited buffer depth of the IDE’s Serial Monitor tool. Instead, one or more capture logs can be used to store a large amount of debugging-related data during normal execution. Later, a “data analysis” mode can be initiated, and the debugging data can be selectively printed in smaller quantities.
By the end of this article you should know enough to be able to implement your own capture log tools. But to save you the trouble, I provide a link to my own library on Github, which you’re free to use.
Debugging Basics
I won’t attempt to provide a comprehensive survey of debugging techniques, but I’ll cover a few key points. First, note that the capture log debugging technique is used to find run-time (execution) bugs, not compile-time bugs. The assumption here is that your program compiles with no errors and runs, but doesn’t produce the expected results. The challenge is to them isolate (i.e. find) the bug in a specific section of your code. There are many types of bugs, but here are some of the most common in my experience:
- Flow Control – In conditional statements (if) and iteration statements (while, for), it’s easy to mistakenly use the wrong relational operator (e.g, “<” instead of “<=”), or to perform a comparison with the wrong variable.
- Initialization – The compiler will produce a warning message if you use a variable before it has been initialized, but it won’t tell you if the variable is initialized to the correct value.
- Computation – It’s quite common for a complex arithmetic expression to produce an unexpected result. This can be caused by misplaced/missing parentheses, or by combining different data types in the same expression.
Finding a bug is usually not possible just by observing the external results of program execution. Running the program with different input conditions will often give you some clues about what sections of the code might be faulty, and those sections then become the targets for further analysis using print-statement or capture log debugging techniques.
Print-Statement Debugging
Print-statement debugging is still useful in some situations, and is relevant in understanding how the capture log technique works. To that end, I’ll describe the evolution of my own approaches to debugging over the past several years. I started by adding Serial.print() and Serial.println() function calls to my code to print key variables during execution. But this quickly became cumbersome, since these functions can only print one piece of data at a time. Printing two integer variables on a single line requires something like this:
Serial.print("var1 = "); // print label for first variable
Serial.print(var1);   // print first variable
Serial.print(" var2 = ");  // label for 2nd variable
Serial.println(var2); // print second variable and end line
It could be a little more compact without the data labels, but I don’t like having to remember how to interpret a screenful of numbers.
After suffering with that method for a while, I discovered the sprintf() function. This function converts the data values into ASCII substrings, and allows these substrings to be combined with the the data labels into a single string that’s ready for printing. The example above would look like this:
char buff[40];  // create a string buffer
sprintf(buff, "var1 = %d var2 = %d", var1, var2);  // build the string
Serial.println(buff);  // print the string
The cool thing about this approach is that it still only requires three lines of code regardless of how many variables and labels are included in the string. The format string (the second parameter to sprintf()) supports a wide variety of format specifiers (like %d) that cover all of the basic data types. One limitation is that the Arduino IDE implementation of sprintf() does not support floating point data types, but this article describes an easy workaround for this. This limitation does not apply to the PlatformIO implementation.
So I was mostly happy with that for a while, but it bothered me that it required three lines of code to print one line of debugging data. Then I stumbled on the printf() command, which is like a clever combination of sprintf() and Serial.print(). This is unfortunately not available in the Arduino IDE, but in the Teensy/PlatformIO environment the example looks like this:
Serial.printf("var1 = %d var2 = %d\n"); //; Voila!At this point in the evolution, my debugging sessions involved adding lots of Serial.printf() statements. I kept forgetting too take them out, so I added a comment like “// DEBUG” to each line to make it easier to find and remove the print statement (or comment it out) when I was done debugging.
Not done yet! I began to wish that I could leave the Serial.printf() commands in the code, and somehow disable them until the next time that needed to track down a bug. A little Google-izing soon revealed the wonders of conditional compilation using the #define and #if compiler preprocessor directives. For example:
#define DEBUG_MODE false    // One location in the program
. . .
#if DEBUG_MODE
Serial.printf("var1 = %d var2 = %d\n");
#endif
This causes the compiler to ignore all the debugging print statements in the program, as long as I remembered to surround them with the #if/#endif sequence. The big advantage of this approach is that no Flash program memory or RAM are consumed by the debugging code. Then, changing the single instance of DEBUG_MODE to true enables all of the print statements.
There’s actually an even more compact way to write this, but I’ll save that for later. The key points I wanted to make in this section are:
- The sprintf() function is a really powerful tool that lets you easily build printable strings from a variety of data types and text.
- Compiler preprocessor directives provide the ability to include debugging-related code in your program only when it’s needed, conserving valuable memory resources when it’s not needed.
Introduction to Capture Logs

As I said earlier, the capture log technique involves storing debugging data in memory buffers during normal execution, and later extracting and examining the data. And if you haven’t already guessed this, the data is stored as strings that have been assembled using the sprintf() function. When a new capture log (which I call a cLog for short) is created, the maximum size is specified along with a couple of parameters that control its behavior. An example of a newly-created (empty) cLog is shown at right. It can hold up to 5 entries, where each entry consists of up to 20 characters (including the automatically-appended null terminating character).
Using my cLog library, this cLog would be created using one of the macros I defined:
CLOG_NEW loopLog(5, 20, NO_TRIGGER, NO_WRAP);To continue with this simple example, let’s assume that I want to log the value of a variable that is computed within a program loop. This is done using the CLOG macro:
int foo;
for (int i = 0; i < 7; i++) {
  <compute new value of foo>
  CLOG(loopLog.add(), "foo[%d] = %d", foo);
}
If you’re really on your game, you’ve realized that the CLOG macro invokes sprintf() and that the call to loopLog.add() returns a pointer to a string into which sprintf() will assemble the log entry based on the following format string.

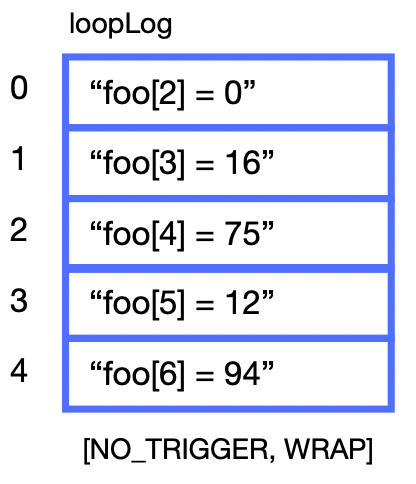
Back to the example…When the loopLog is examined (we’ll get to how later), it might look as shown at right. Even though the loop iterates 7 times, only the first 5 entries are captured, based on the maximum size that was previously defined. If it were important to capture the values for all loop iterations, the cLog could have been sized larger. But if it were more important to capture only the values of foo in the last 5 loop iterations, the WRAP option could have been selected instead of NO_WRAP.
When the WRAP option is selected, the behavior is the same as NO_WRAP until the cLog becomes full. After that, the oldest entry is deleted to make room for each new entry. So in this case, after 7 loop iterations the cLog might look like this.
Both the CLOG_NEW and CLOG macros are defined so that they only work when the program contains the line:
#define CLOG_ENABLE trueWhen CLOG_ENABLE is false, the macros prevent any significant use of memory resources. so the statements can be left in the code without impact. An unlimited number of cLogs can be defined and independently used, since each has a unique name.
cLog Triggering
In some scenarios it’s desirable to add cLog entries only under certain conditions. This can be with a conditional if statement before each CLOG macro, but there’s a more convenient method using the TRIGGER option when the cLog is created. In that case, the cLog is not activated until a call is made to loopLog.trigger(). Prior to that, none of the CLOG macros (for that specific cLog) have any effect. For example:
CLOG_NEW loopLog(5, 20, NO_TRIGGER, NO_WRAP);
...
int foo;
for (int i = 0; i < 8; i++) {
  <compute new value of foo>
  if (foo == 75)
    loopLog.trigger();
  CLOG(loopLog.add(), "foo[%d] = %d", foo);
}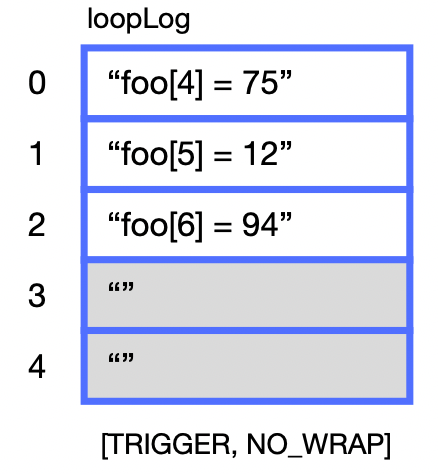
Afterwards the cLog would look like this:
There’s also a logName.freeze() function that allows the cLog to be conditionally de-activated.
Accessing a cLog
Any of the cLogs that were created and filled during program execution can be accessed at any time using the logName.get() function. The number of valid entries in the cLog can be determined using a logName.numEntries variable. The example cLog above can be printed with the following code:
for (int entry = 0; entry < loopLog.numEntries; entry++)
  Serial.println(loopLog.get(entry);
Instead of printing, the get() function can also be used to access the log and transfer it to another computer via a WiFi, Bluetooth or serial interface. This can be useful when the board being debugged is installed in a remote location and not directly connected to the serial monitor.
cLog Menu Functions
To simplify the process of accessing and printing cLogs, I’ve created an additional cLogMenu class and associated functions. A simple character-based “menu” allows you to select a specific cLog to be printed to the serial monitor, and the printing function supports pagination to help deal with large quantities of data. For example, suppose you had 3 cLogs that you wanted to access via the menu, and you wanted to print the log in 10-entry “pages”:
cLogMenuClass menu(3, 10);This creates an object named menu. The next step is to add each of the cLogs to the menu structure along with the some descriptive information:
menu.addLog(&myLog1, '1', "This is myLog1");
menu.addLog(&myLog2, '2', "This is myLog2");
menu.addLog(&myLog3, '3', "This is myLog2");
The first parameter to addLog() is a pointer to a cLog object. The second parameter specifies the serial monitor keyboard character that will be used to select that cLog. The third parameter is a descriptive string that will be printed at the top of each page (of 10 entries in this example).
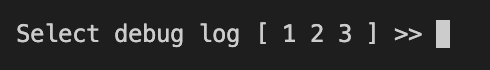
Next, menu.logMenu() is called (no parameters) to initiate the menu, resulting in the following output:
Pressing the character ‘2’ on the serial monitor keyboard results in:
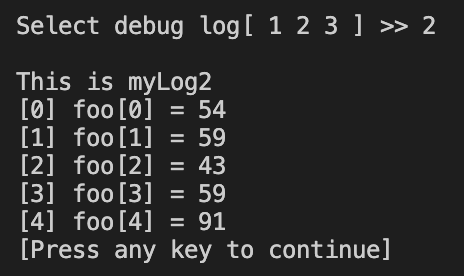
Pressing any key other than ‘x’ causes the remaining 10 entries to be printed. Pressing ‘x’ causes a return to the menu prompt. Pressing ‘x’ at the main menu prompt causes an exit from the menu.
The call to logMenu() would typically be initiated by an external action that triggers entry into the “data analysis” mode that I referred to at the beginning of the article. For example the program, along with its normal functions, could periodically check a pushbutton switch, or look for a special character typed on the serial monitor keyboard.
CaptureLog Libraries
I’ve created two public repositories on Github: CaptureLog and CaptureLogMenu. The CaptureLog library can be used independently, but the CaptureLogMenu library is intended to be used in conjunction with CaptureLog. Each repository also includes a simple example program to better illustrate the library usage.
The easiest way to download these libraries is to click the <Latest> button in the Releases section on the right-hand side of the Github page.
These libraries have been tested in the PlatformIO and Arduino IDE environments. Depending on the environment used, different types of massaging may be required to install and use the libraries and example programs. For example, the CaptureLog example program needs to be renamed from cLogTest.cpp to cLogTest.ino for the Arduino environment.
The various .h and .cpp files can be copy/pasted into an existing program or sketch, or they can be installed as a library. This article explains the process for the Arduino IDE. The process for PlatformIO is either easier or harder, depending on your perspective, but there are plenty of tutorials online.
One more note: Both of these libraries use dynamic memory allocation, using the C++ new operator. Memory is only allocated when CLOG_ENABLE is true, and the amount of memory allocated depends heavily on the specified sizes of the cLog data structures. On memory-constrained platforms, it may be best to keep the number of cLog entries as small as possible, and constrain the length of the cLog strings.
